
Use the power of VertiGIS Networks Explorer to quickly access, visualize and analyze utility network data, create topical evaluations and generate the reports you need — whether online or off.

Easy Information Sharing
Share your network data with those who need it with just a couple clicks of a mouse.

Quick Data Correlation
Analyze your data streams from feed-ins, smart meters or grid operations and detect correlations.

Out-of-the-Box Configuration
Save time and money with a standard solution that still allows for custom configuration.
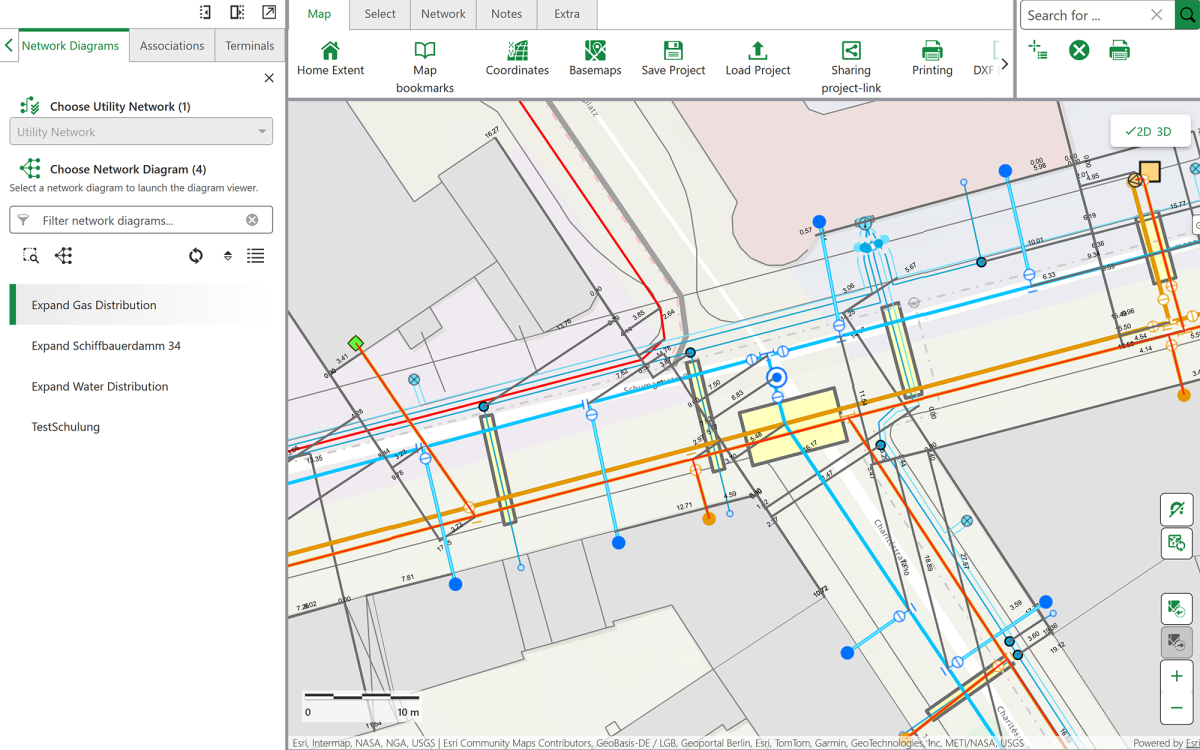
Network tracing and topological evaluation
Visualize and check relationships, switching states or the effect of events via network tracking. Present your results in a map or list and generate reports.
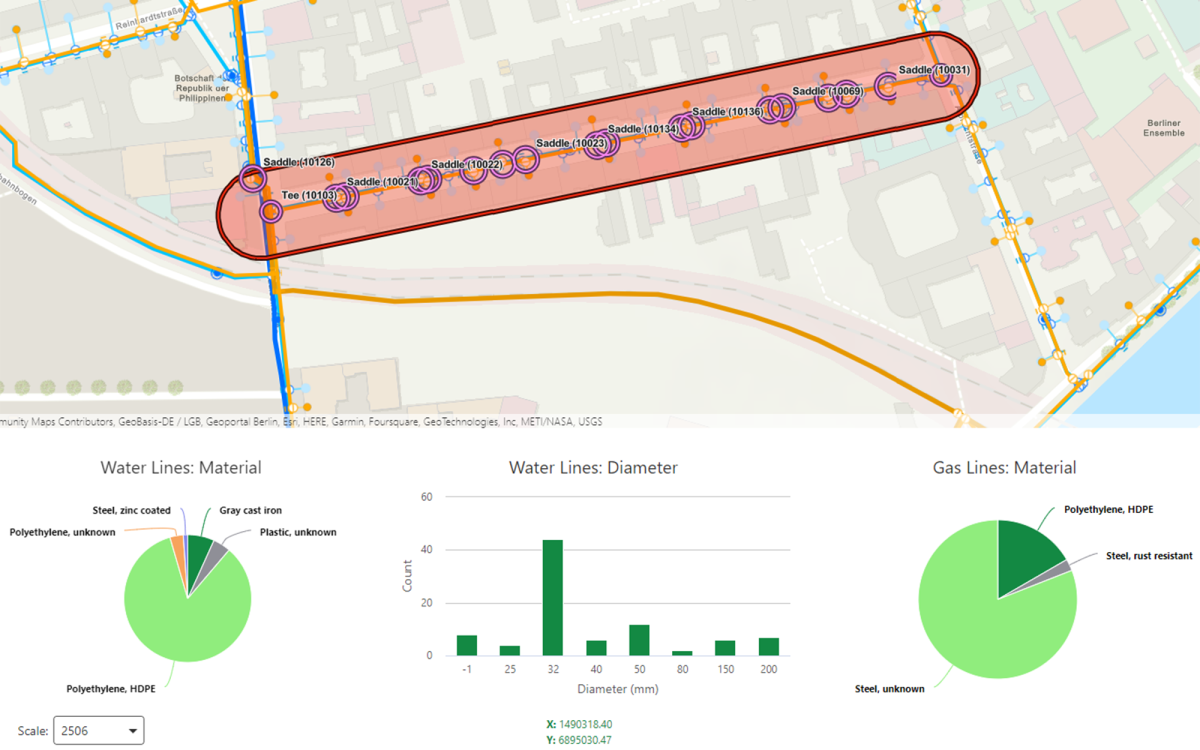
Queries, reports and statistics
Relate network data to other data, visualize complex relationships on a map, diagram or infographic, and create the reports you need.
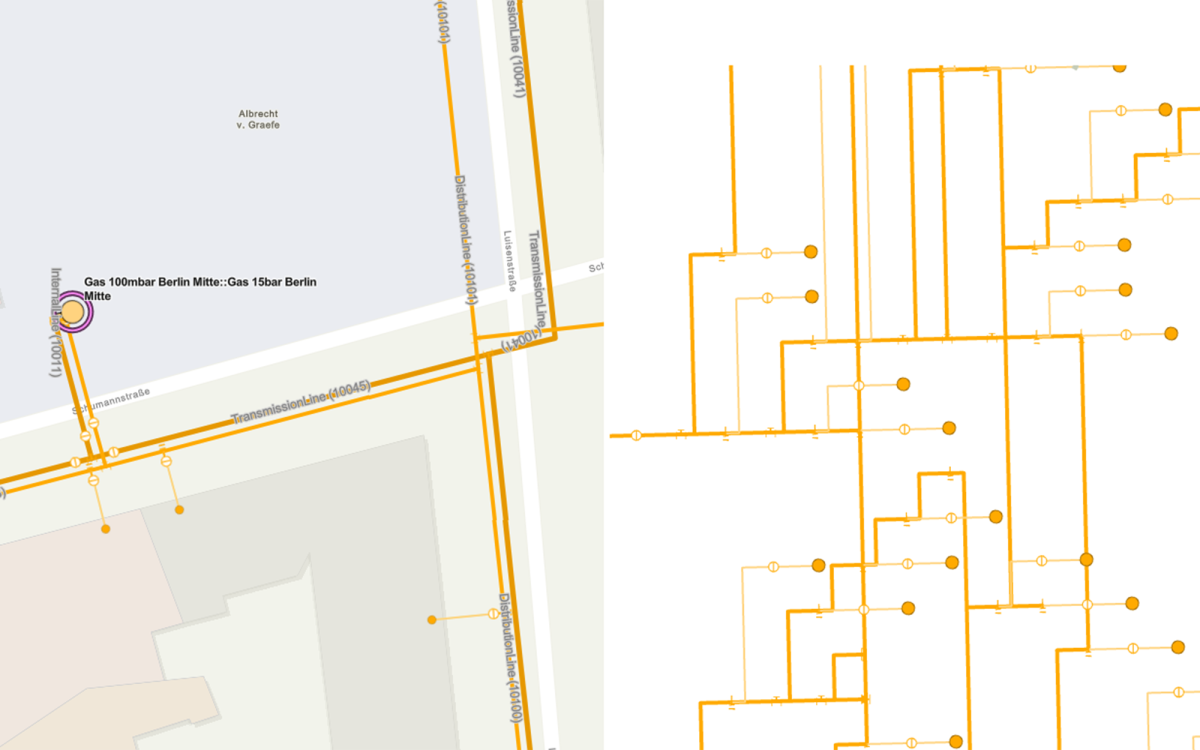
Display logical views as a schematic diagram
Create a schematic representation of your network data for both technical and operational purposes or to make it easier to understand important logical relationships.
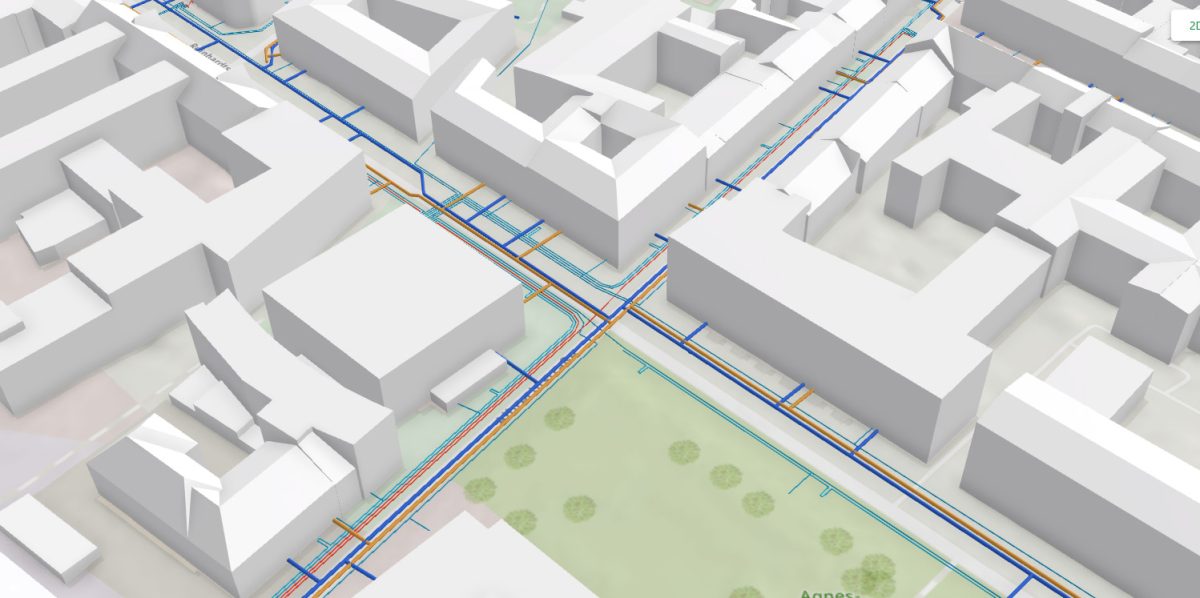
2D and 3D views
Better understand your network data and the spatial relationship between your infrastructure and the world around it by toggling between 2D and 3D views.

Sketch, note and measure
Expand and enhance the map with notes and highlighted areas, or measure lengths, areas and angles.
Print all sizes
Meet any print requirement from email templates to high-resolution custom plans all while controlling access by user type as required.

Flexible configuration for customization
Tailor VertiGIS Networks Explorer according to your business processes via a configurable web-based designer that limits the need for costly and challenging custom development.
Related Story
Future of GIS: Transforming Businesses with Geospatial Insights
Written by Greg Brazeau, Director of Sales, Utilities What if your most important asset isn’t a transformer or a substation, but the system that understands the relationship between all your Read More
Related Story
Future of GIS: Transforming Businesses with Geospatial Insights
Written by Andy Berry, CEO VertiGIS Next-gen GIS technology uses AI, cloud computing, and mobile accessibility to streamline business processes, improving efficiency, decisions, and sustainability. Geographic Information Systems (GIS) are Read More
Related Story
Video: Modernizing Spatial Asset Management with VertiGIS Neo
Discover how VertiGIS Neo empowers energy, telecommunications, and municipal sectors to overcome challenges like aging infrastructure and climate impacts. With modern GIS applications, cloud strategies, and AI innovations, VertiGIS Neo Read More
Related Story
Geospatial Network Operations Management: A New Era for Utilities
Game-changing Technologies Revolutionize how Networks are Monitored, Maintained, and Optimized Written by Steve Grise, Head of Strategic Consulting at VertiGIS The Role of GIS in Modern Utility Management Geographic Information Read More
Related Story
European Power Utilities Face Multiple Challenges in 2025 and Beyond
From Energy Transition to Decarbonisation and Grid ModernisationWritten by Christoph Spörri, Product Director Utilities, VertiGIS In 2025, the large-scale integration of renewable energy sources will continue across Europe, with Read More
